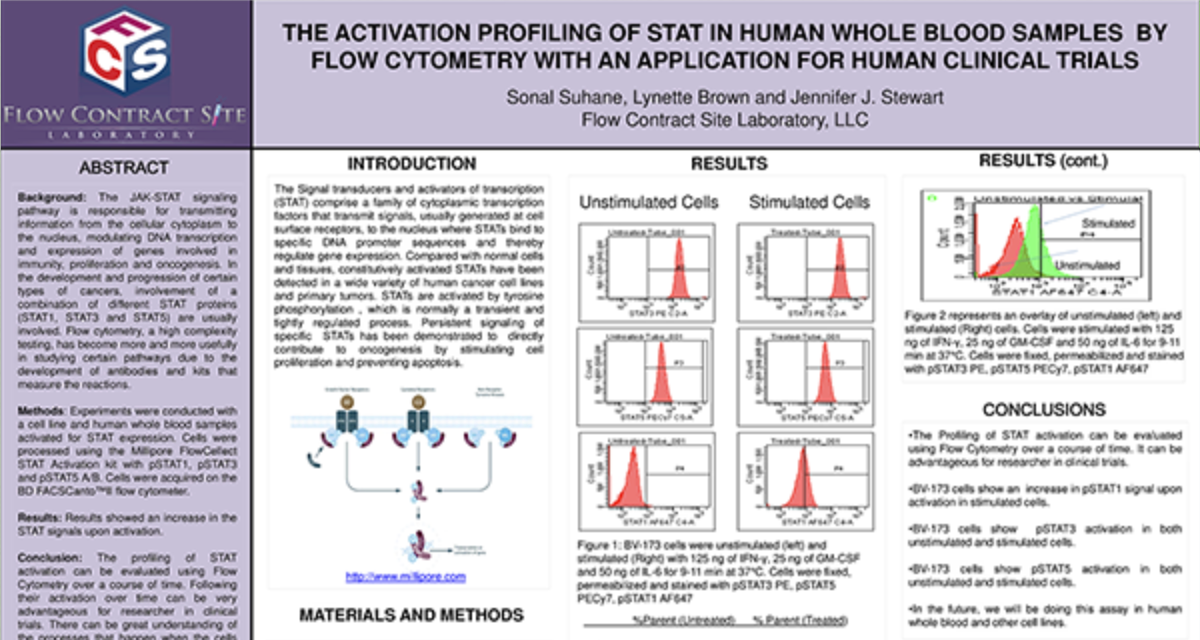
Receptor Occupancy
Receptor occupancy assays are a method for identifying and monitoring the binding of a therapeutic to its cellular target. These assays can be as simple as measuring the number of cell surface receptors bound by a therapeutic agent or highly complex such as measuring receptor dynamics, depending on the scientific questions being studied. Evaluating receptor occupancy during the development of new biologic drugs is crucial not only for candidate selection in the early stages but also to confirm that the therapeutic is binding to its cellular target and establishing the dose or plasma concentration needed to reach a therapeutically-effective receptor occupancy level when combined with pharmacokinetic (PK) and pharmacodynamic (PD) data.
Flow cytometry, the leading technology for single cell multiplex analysis, is ideally suited for receptor occupancy assays, which are most often applied to the evaluation of therapies targeting peripheral blood cells. At TD2 we provide custom developed receptor occupancy assays based on client defined parameters to identify the binding of therapeutic compound to its specific target.
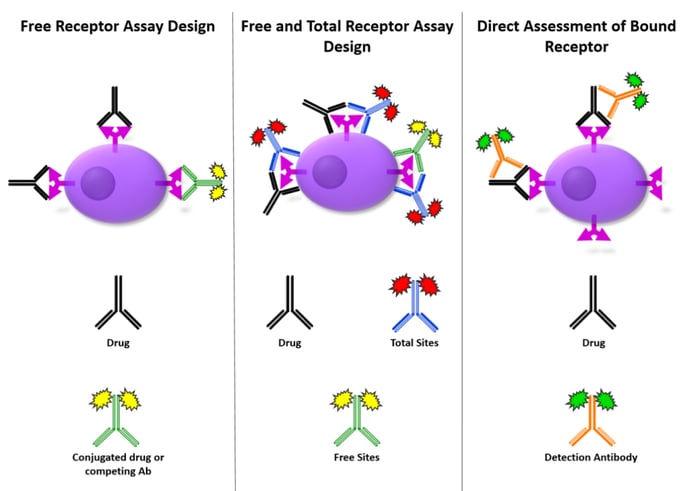
Assessment of receptor occupancy by flow cytometry can take several approaches:
- Free Receptor Assay: Shown in the Left Panel is an illustration of free receptors that are not occupied by biotherapeutic agent detected using either a fluorescently labeled competitive antibody or biotherapeutic agent.
- Free and Total Receptor Assay: Shown in the Middle Panel is an illustration of free and total receptor assay design which depicts the total receptors available, recognized by a noncompetitive antibody bound to a different epitope on the receptor from the one recognized by the biotherapeutic agent. This design can be used determine the ratio of free (unoccupied) sites to total sites available.
- Direct Assessment of Bound Receptor: Shown in the Right Panel is an illustration of direct assessment of bound receptor with biotherapeutic agent, typically detected with a fluorescently labeled anti-drug antibody.
Request more information about Receptor Occupancy
Contact our experts to help advance your drug development with TD2's trusted Flow Cytometry Services.
This can be evaluated using direct or indirect methods. We can help you to move your novel biologic to the development of targeted drug. Please inquire to start the scientific discussion.
References
Litwin V, Green C, Stewart JJ (2016) Receptor occupancy by flow cytometry. Cytometry B Clin Cytom 90:108–109. doi: 10.1002/cyto.b.21364
Stewart JJ, Green CL, Jones N, Liang M, Xu Y, Wilkins D, Moulard M, Czechowska K, Lanham D, McCloskey TW, et al. Role of receptor occupancy assays by flow cytometry in drug development 2016;90:110–116.
Additional Resources


Regulatory, Clinical, Preclinical, PK/ADME, Flow
Comprehensive Oncology Ecosystem

![]() Receptor Occupancy
Receptor Occupancy
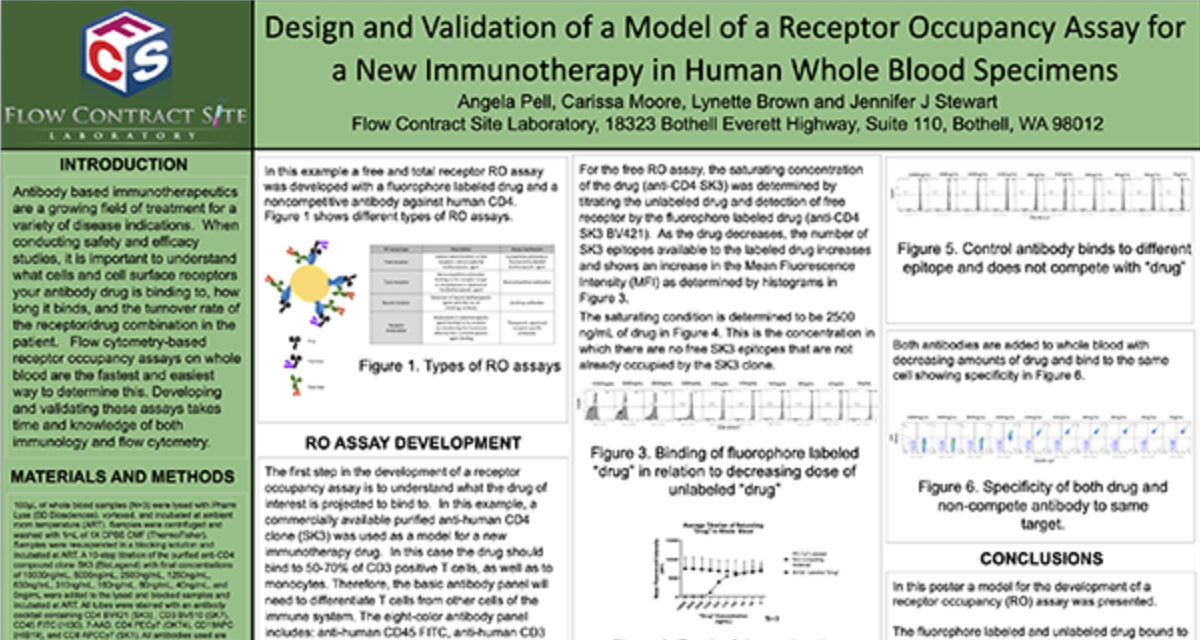
Binding of fluorophore labeled “drug” in relation to decreasing dose of unlabeled “drug”

![]() Receptor Occupancy
Receptor Occupancy
![]() PBMC Services
PBMC Services
Evaluate responses of PBMCs by profiling the function/phenotype of subpopulations

![]() Immune Population Phenotyping
Immune Population Phenotyping
Immune cell population analysis of subcutaneous CT26 murine colon carcinoma tumors
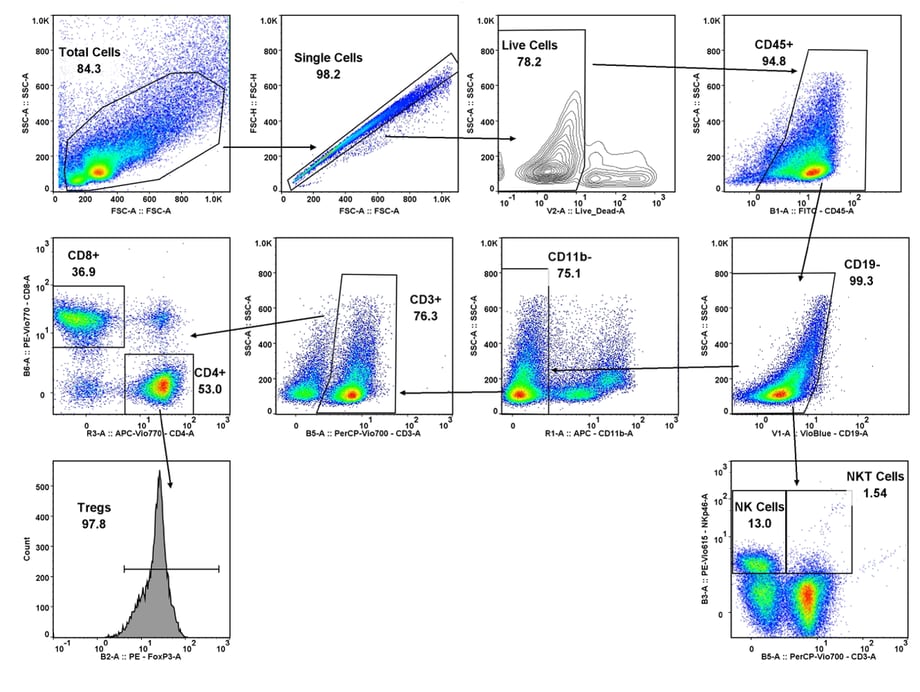
CT26 SC tumors: Gating strategy T cells and NK cells.
Gating involved identifying the total cell population, and then gate out the doublets, gate out the dead cells, move on to our first marker CD45 which gates out any non-immune cells. The bottom right cytogram shows the different NK cell populations. The far left middle cytogram depicts the two T cell population CD4+ and CD8+. Values are % of total CD45+ cells.
![]() Cancer Cells/Tumor Specific Marker Expression
Cancer Cells/Tumor Specific Marker Expression
Cancer cells/tumors specific markers expression
- Viability dye inclusion
- Cell lines and single-cell suspension tumors
- Surface staining

![]() Fluorescent Proteins Expression
Fluorescent Proteins Expression
Fluorescent proteins expression
- Viability dye inclusion
- Cell lines and transfected primary cells
- Surface staining

![]() Cell Cycle Analysis
Cell Cycle Analysis
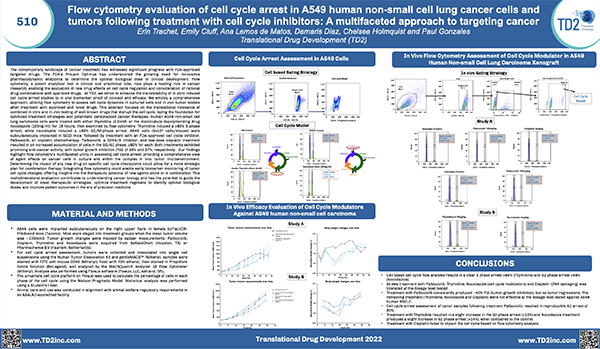
Cell cycle analysis A549 cells
- Propidium iodide
- Cell lines

![]() Intracellular Protein Analysis
Intracellular Protein Analysis
- Intracellular Cytokines
- Phosphorylated Proteins
- T-Regs
- Phosphoroteins
- Cytokines

![]() Cellular Functional Assays
Cellular Functional Assays
- NK Cell Function
- Basophil Activation Test (BAT)
